STATISTICS VENEZUELA: GDP, OIL RESERVES, REFINING CAPACITY, CRUDE PRODUCTION, EXPORTS, EXCHANGE RATE, CONSUMER PRICE INDEX, HOUSING EXPENDITURE
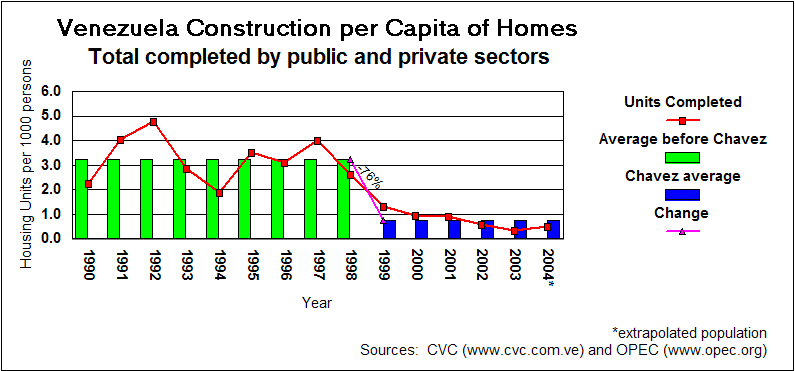
Other graphs on public spending on housing may misleadingly
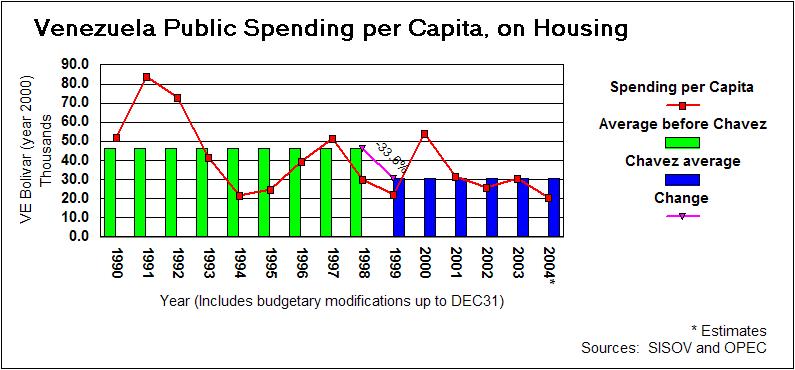
show lines with an upward slope, but it is for failure to adjust for
other factors. Namely, this graph uses constant Venezuelan Bolivar
currency (year 2000), and adjusts for population growth, depicted by
the long-line plot. The bars represent the average yearly public
spending per capita on housing for the nine years previous to Hugo
Chavez's administration, then for the six years of Chavez's
administration.
The short-line plot emphasizes and
quantifies what is visually clear from the bars: Chavez's
administration has been spending only two thirds of what his
predecessors were spending.
For Chavez's administration to make up for the difference in 2005 and merely *match*
what preceeding adminstrations were spending on housing, it would have
to increase its 2004 spending by 1,130%! Unfortunately, referring back
to the long-line plot, it is clear that as years go by Chavez's
administration is *decreasing* an already small spenditure.
The spending numbers were found at http://www.sisov.mpd.gov.ve ; the population numbers were found at or extrapolated from http://www.opec.org/library/Annual%20statistical%20Bulletin/pdf/AB002003.pdf